There are two basic ways for the government to deter crime: increase punishment (more prison) or increase the probability of punishment (more police). The United States differs from European countries in how it mixes these approaches.
- The US and EU both spend about 1.2% of GDP on police and prisons, but while the EU spends about 5 to 1 in favor of police, the US spends just 1.5 to 1.
- As a share of GDP, the EU spends 33% more than the US on police and 60% less on prisons.
- In the US, the ratio has shifted significantly over time to favor more prison. Prior to the late 1970s, when incarceration rates started to take off around the country, the US consistently spent about 3 to 1 on police.
- Comparing individual US states and EU members shows that the averages aren’t being skewed by outliers. Only one US state had a higher police-to-prison ratio than any European country.
The United States
Since the 1950s, the United States has increased spending on both kinds of deterrent, leveling off around a combined 1.2% of GDP after 2001.
Chart 1:

However, while spending increased, the distribution has changed. Starting in the late 1970s, there has been a relative shift of resources away from police and toward prisons.
From 1950-1975, the ratio of spending on police vs. prisons stayed around 3 to 1 — that is, for every $1 spent on prisons, the US spent $3 on police.
But as the US incarceration rate skyrocketed, the ratio plunged to a low of 1.17 to 1, before creeping back to 1.5 to 1 as prison populations leveled off. In 2015, the US spent just $1.50 on police for every $1 on prisons.
Chart 2:

The European Union
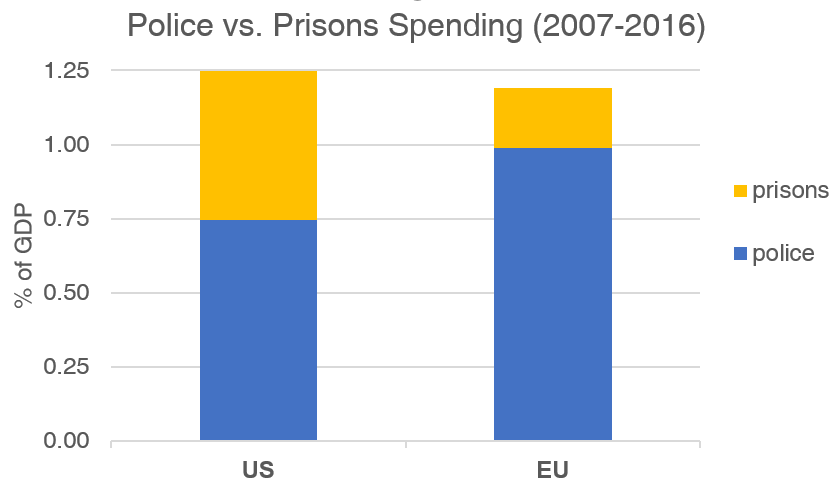
According to Eurostat, the EU spends roughly the same share of GDP on police and prisons as the US (about 1.2%), but the breakdown is very different.
Over the last decade (2007-2016), the US spent an average of 0.75% of GDP on police and 0.5% on prisons — a ratio of 1.5 to 1. The EU (as currently composed) spent an average of 1% on police and 0.2% on prisons — a ratio of 5 to 1.
Chart 3:

Unfortunately, Eurostat only has data for the current 28-nation European Union back to 2007, so the time series is limited to the last decade.
Eurostat does have national spending data for 15 countries going back to 1995 (strangely, though, these aren’t the “EU-15” nations that composed the EU until its expansion in 2004).
The ratio for this group suggests that they follow the broader European trend pretty closely — about 5 to 1 on police — and this has probably been the case for Europe since at least the mid-1990s.
Chart 4:

This suggests that the US and European strategies for deterring crime are quite different. (Needless to say, there are complicating factors that might also affect spending — for instance, international differences in the costs of prison construction, or in the labor costs of police forces.)
Note that, because the United States is more violent than the EU, you might expect that the US would have a higher level of spending — but it wouldn’t obviously suggest there should be a different mix between police and prison. (And, in fact, the US doesn’t spend much more than Europe, overall, despite its higher violent crime rate.)
US States vs. EU States
In 2016, only one US state had a higher police-to-prison spending ratio than any EU country.
Illinois (2.8 to 1) narrowly edged out the Netherlands (2.5 to 1). Three US states (Nebraska, Virginia, and Kentucky) had ratios that are less than one — that is, they actually spend more on prisons than police.
Chart 5:

The variance in total spending isn’t much greater in Europe than in the US (see methodological notes below), but Europe’s ratios are all over the place.
European countries almost uniformly spend a much larger share on police than US states, though just how much larger varies wildly.
Chart 6:

Update: GDP?
Commenter “M” at Marginal Revolution asks, “Looks like some trend of lower ratios in richer European states. Prison as a luxury good sustained by richer states, and US ‘over’ imprisonment (partially) explained by high US wealth?”
It’s not a bad guess, and, in some sense, incarceration is a luxury because it’s a vastly more expensive way to deter crime. So I thought I’d plot it out. Eyeballing the European data, you can see that M is not total imagining it, but the relationship is very weak.

Besides not controlling for the many other ways that richer states differ, the relationship is practically nonexistent within the United States… and the sign flips.
I’d also note that differences in GDP per capita don’t explain long stretches of stability in the US time series. From 1950-1975 and 1990-2015, the trend for the US ratio is flat, even while GDP per capita was growing.
The map chart hints at Europe’s typical north/south, east/west divisions, but GDP just doesn’t explain much — and that’s consistent with other research on incarceration. (Relevant additional reading: “An empirical examination of institutions and cross‑country incarceration rates.”)

Sources and Calculations
Chart 1: US police and prison spending as a share of GDP since 1950 come directly from USgovernmentspending.com. A full table of the data and sources are available at the link. The original source for GDP is the BEA; federal, state, and local spending data to 1970 are from the Census Bureau (Historical Statistics of the United States, Colonial Times to 1970); federal data from 1970-2015 is from OMB; state and local data from 1970-2015 is the Census Bureau (Annual Survey of State and Local Government Finances).
Chart 2: The police-to-prison ratio line is my own calculation based on the data from Chart 1 (simply divide police spending by prison spending). The incarceration rate line comes from the Albany Sourcebook of Criminal Justice Statistics.
Chart 3: The US spending figures come from Chart 1. The EU data comes from Eurostat. Use this bookmark to go directly to the table I generated.
Chart 4: The US ratio line is the same as Chart 1. The EU ratio line is my own calculation based on police and prison spending data from Eurostat used in Chart 3.
The “Europe-15” ratio is my own calculation for the 15 countries with Eurostat data extending back to 1995. I averaged the group’s police and prison spending as a share of GDP for each year, and then divided the average for police by the average for prisons.
Chart 5: The ratios for US states are my own calculation based on data from the Census’s 2016 State & Local Government Finance Historical Datasets and Tables, Table 1, lines 92 (“Police protection”) and 94 (“Correction”).
The ratios for EU countries are my calculation based on the Eurostat spending data. To be as precise as the ratios for states, I calculated these country-level ratios using figures denominated in millions of euros, rather than as a percent of GDP. (Eurostat only gives share of GDP figures to a single decimal place.)
Chart 6: Total spending (police + prisons) as a share of GDP for US states is my calculation, based on the spending figures from the Census used in Chart 5, and state GDP figures from the Bureau of Economic Analysis. Total spending as a share of GDP for European countries is from the same Eurostat table as before. The ratios for both the US and Europe are from Chart 5.
Methodological Notes
Spending totals and ratios for US states in Charts 5 and 6 include all state and local spending; the dataset does not include DC or the federal government.
The European dataset in Charts 5 and 6 includes three non-EU members: Iceland, Norway, and Switzerland.
The standard deviation on total spending is about 0.29 percentage points for European countries and 0.2 percentage points for US states. The SD on police:prison ratios, however, was 3.4 for Europe and 0.4 for the US.