Update with data through 2013 available here.
One question that has been confounding throughout my research on the relative dangers of police work is, quite simply, how many police are there in the United States?
Like many of the issues raised by this series, this is not as simple as you might think, and it’s proven surprisingly hard to answer.
First, you need to define what counts as “law enforcement personnel.” Do we count everyone employed by law enforcement agencies? Or only patrol officers? Or officers, deputies, detectives, and supervisors? Or only “sworn” personnel? Do we count part-time or full-time? Are there confounding variables (like officers who work for multiple agencies)?
Then you need to decide if you’re looking at state, or local, or both, or federal, or all of the above. Then you need to decide which organization’s numbers you’re going to use — BLS? NLEOMF? FBI? BJS? — and trust. All of these organizations report conflicting numbers. What’s their methodology? What’s the margin of error? And how old are the numbers?
Headaches multiply. Simplicity is needed. Here’s the four sources I looked at when trying to establish the number of cops in the US.
National Law Enforcement Officers Memorial Fund
In my previous posts, I used the NLEOMF figure of “more than 900,000 sworn law enforcement officers now serving in the United States…the highest figure ever.” I did this for several reasons.
- It was the most recent estimate that I could find, and it is the most widely cited.
- NLEOMF is dedicated full time to looking at these questions and is in touch with most law enforcement agencies in the country. “The Fund maintains the largest, most comprehensive database of line-of-duty officer deaths, which serves as a national information clearinghouse on the topic” (NLEOMF, via DOJ). If anyone would know, presumably, they would.
- It was consistent. I used the Fund’s data for officer fatalities, so I should use their data for officers, when possible, to keep definitions and data comparable.
- It was a conservative figure. I calculated my 2013 fatality rate per 100,000 officers using the estimate of 900,000 officers. Since NLEOMF estimated the true figure was actually more than 900,000, my rates would, if anything, overstate how high fatality rates were.
- Finally, the Fund counts only “sworn officers,” meaning personnel with general arrest powers, such as patrol officers, deputies, and detectives. This is the most useful and relevant category when we talk about police potentially in harm’s way.
But it is not the only figure available. *Update below.
Bureau of Labor Statistics
Why didn’t I use BLS data for law enforcement deaths? After all, BLS maintains the largest general database of work injury and fatality rates for different professions.
The reason, bluntly, is that their data for law enforcement is a goddamn mess. I painstakingly compiled this chart from individual PDF files (for god’s sake!) for each year’s survey from the BLS website:
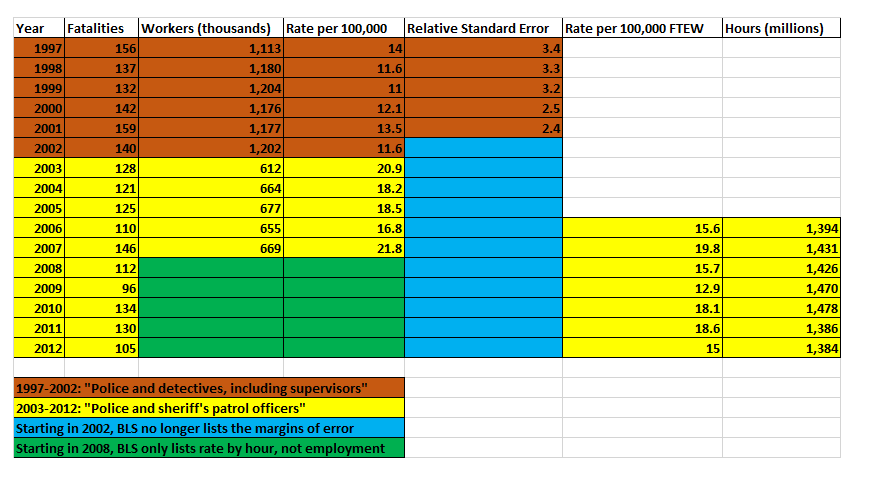
First, BLS relies on polling data that has an unacceptably high margin of error (for any given profession) if we want to explore trends or closely compare rates year to year. For instance, in 1997, BLS estimated a fatality rate for law enforcement of 14.0 per 100,000, +/- 3.4 per 100,000. This is a margin of error of 25%. It might be the best BLS could do given its resources, but it’s useless for our purposes. (They also stopped listing the relative standard error for their results in 2002.)
The next problem is that their law enforcement category definition changed in 2003, from “police and detectives, including supervisors” (whatever exactly that may mean), with an estimated 1.1 million workers, to “police and sheriff’s patrol officers” with estimates in the 600,000 range. Fatality rates jumped accordingly.
Then in 2008, BLS stopped offering employment-based estimates (that is, fatalities per 100,000 workers) and started using hour-based estimates (fatalities per 100,000 full-time equivalent workers, equivalent to 2,000 hours/year per FTEW). In most cases, this is a methodological improvement, but coming in the middle of the data set, it makes it even harder to compare rates over time.
Trying to establish trends from this data is a fool’s errand.
Federal Bureau of Investigation
The FBI’s Uniform Crime Reports includes an annual report on law enforcement officers assaulted or killed, as well as rates of assault and injury. This data is very useful, but it has some key limitations.
The data on unlawful killings of police is virtually complete — almost all homicides of any kind are reported to the FBI — but the data set on assaults and injuries is not.
Police departments can voluntarily submit reports to the FBI on the number of assaults and injuries suffered by their personnel, as well as the number of officers in their organization. But not all in fact do so. The result is that the absolute or raw number of assaults can vary greatly from year to year simply because of the number of law enforcement agencies that participate in the survey also varies.
Fortunately, the FBI also collects information about the total population policed by the departments that reported, as well as information about the total number of officers employed by the surveyed organizations. As a result, you can get reliable and comparable yearly estimates of the rates of assault and injury, based on both the number of assaults per 100,000 residents, or the percent of officers assaulted.

Typically, the FBI figures for assaults on law enforcement include about 8,000-11,000 out of the 16,000-18,000 state and local law enforcement agencies in the US. The agencies generally cover between 70-80% of the US population, and, in the last 15 years for which data is available, included as many as 535,000 officers and as few as 441,000.
Their criteria and methodology for which officers to include is also clear and consistent:
- They were working in an official capacity, whether on or off duty.
- They had full arrest powers.
- They ordinarily wore/carried a badge and a firearm.
- They were paid from governmental funds set aside specifically for payment of sworn law enforcement representatives.
- Their agency reported data for all 12 months of the calendar year.
This is a more than representative sample for getting annual rates per capita and rates per officer for assault and injury, and we’re lucky to have such a robust data set.
That being said, there are a few issues to note. First, at least potentially, there may be selection bias. If your agency is large, dependent on federal funding, or has high rates of assault and injury, you are probably more likely to take the time to fill out and submit this paperwork.
Most departments do, but between one third and one half do not. This could be for many different reasons, but if you are a small or understaffed agency — half of all police agencies in 2008 had fewer than 10 full-time staff — serving a relatively peaceful rural area, for instance, and had commensurately few assaults or injuries, you might not take the time. This could skew the rates upwards, as the agencies with the lowest rates of assault select themselves out of the pool.
But that is not pertinent to the question of how many police there are. The answer here is simply that the data is too incomplete. A third or more of police agencies do not report and are not counted, so FBI doesn’t have a full account of personnel employed, and we can’t extrapolate from the existing data because of potential selection issues raised above.
Bureau of Justice Statistics
The BJS is probably the best government data I’ve been able to find, but it is also quite limited. The last estimates they have come from 2008. (A law enforcement census for 2012 has been commissioned to NORC, but does not appear to have been completed yet.)
BJS estimates that in 2008, there were 17,895 law enforcement agencies employing 1.13 million full-time workers, including over 765,000 sworn officers, as well as about 100,000 part-time employees, including over 44,000 sworn officers. That gives a total of full- and part-time employees with general arrest powers of about 810,000 in 2008.
From 2004 to 2008, the number of law enforcement personnel increased 5.3 percent, and the number of sworn officers increased by about 4.6 percent. This rate was larger than the 3.4 percent increase in sworn officers that occurred in the last four year period, from 2000 to 2004. There are not only more officers than previously, the rate of increase was (and perhaps is still) accelerating.
Moreover, the number of cops per capita is also increasing. Another BJS report estimates that the number of sworn officers increased 25 percent between 1992 and 2008. Over the same time, the US population as a whole only grew by 18.5 percent.
Most of the increase in sworn officers per capita happened between 1992 and 1996, when the number of sworn personnel jumped 9.1 percent, but the number of civilian employees per capita has grown steadily and continuously. The number of total police personnel per capita rose from 332 per 100,000 residents in 1992 to 373 per 100,000 in 2008.

Additionally, these figures, including the rate of increase and rate of acceleration, make the current NLEOMF estimate of “over 900,000 sworn officers” seem quite plausible, if a bit high, assuming an average of 45,000 part-time sworn officers as in previous years.
The Bottom Line
In yet another way, the numbers show that police work is getting safer, not more dangerous. There are more officers and support staff than ever, and they are safer than ever, in every way we can measure.
While the absolute number of officer fatalities is decreasing, the absolute number of officers is increasing. While the rate of fatalities per capita is falling, the rate of police per capita is rising. Thus, the rate of fatalities per officer is very likely also falling.
BJS only conducts its law enforcement census every four years, so we are obliged to take an annual average of the change between each data point in order to get a figure for the intervening years. Interpolating the number of police officers for the missing years in this way, and using fatality data from NLEOMF and homicide data from FBI, gives us approximate fatality and homicide rates per 100,000 full-time equivalent sworn officers. (BJS calculates the total number of “full-time equivalent sworn officers” as “as the sum of the number of full-time sworn officers and half the number of part-time sworn officers.”)

Again, the trends all point the same way: down. Whether we look at fatalities per 100,000 residents being policed or per 100,000 sworn officers, or whether we look at felony killings per 100,000 residents or sworn officers, it tells the same story at every level: police work is getting safer.
Updates, Errata, Etc.
One potential issue this new data might raise with my previous posts is that my estimated rate of officer fatalities for 2013 may be either too high or too low.
The underestimation may come from the fact that I used a lower bound (900,000 sworn officers) when the true figure, according to NLEOMF, is “more than” that. If it is a lot more than that, it could substantially affect my estimate.
The underestimation could come from the fact that NLEOMF’s count of “sworn officers” might include part-time officers. Of course, BLS also used employment-based methodology for worker fatality rates, up until 2007, so there’s nothing wrong with this method per se.
However, since then, BLS switched to the more useful hour-based “full-time equivalent workers.” The fatality rates for other professions, such as logging and fishing, against which I contrasted with my estimated fatality rate for police, used the modern method of FTEW. In order to make a more accurate comparison, one must use hour-based, not employment based, data.
If and when NLEOMF responds to my request (see update below) and provides me with the more accurate data, I will re-check my numbers and make updates accordingly. Please do email me if you spot any errors or have any questions.
Errata: Because of an error I made in transforming cells in Excel (multiplying by 10 rather than dividing by 10), the big chart at the bottom originally showed the fatality and felony killing rate per 100,000 residents two decimal places off. It doesn’t change the trend at all, but it means that the rate is so much smaller it has to be displayed on a second axis. The current chart corrects that.
Update: I asked the NLEOMF to explain their 900,000 estimate; their response was that the figure is
a general estimate derived from discussions with various law enforcement agencies such as the FBI, U.S. Justice Department, National Sheriffs’ Association, National Association of Police Officers, National Troopers Coalition, etc. […] NLEOMF includes all sworn officers in this number whether full or part time.
Make of that what you will. I’m not sure how to parse a “general estimate derived from discussions.”